Welcome to the Living Goods Integrity Line
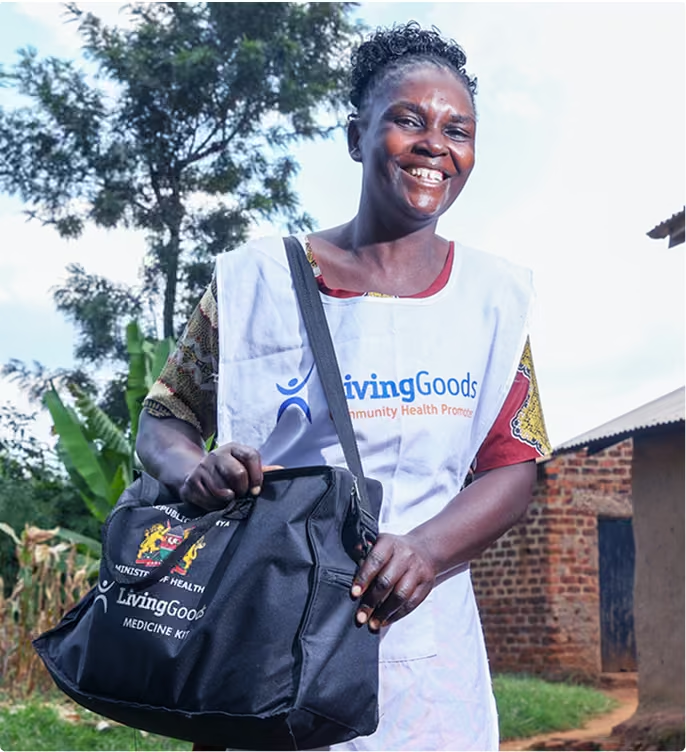
Living Goods is committed to upholding the highest ethical standards in all our activities. We expect all stakeholders—including staff, contractors, volunteers, interns, freelance consultants, and partners—to act with integrity and accountability.
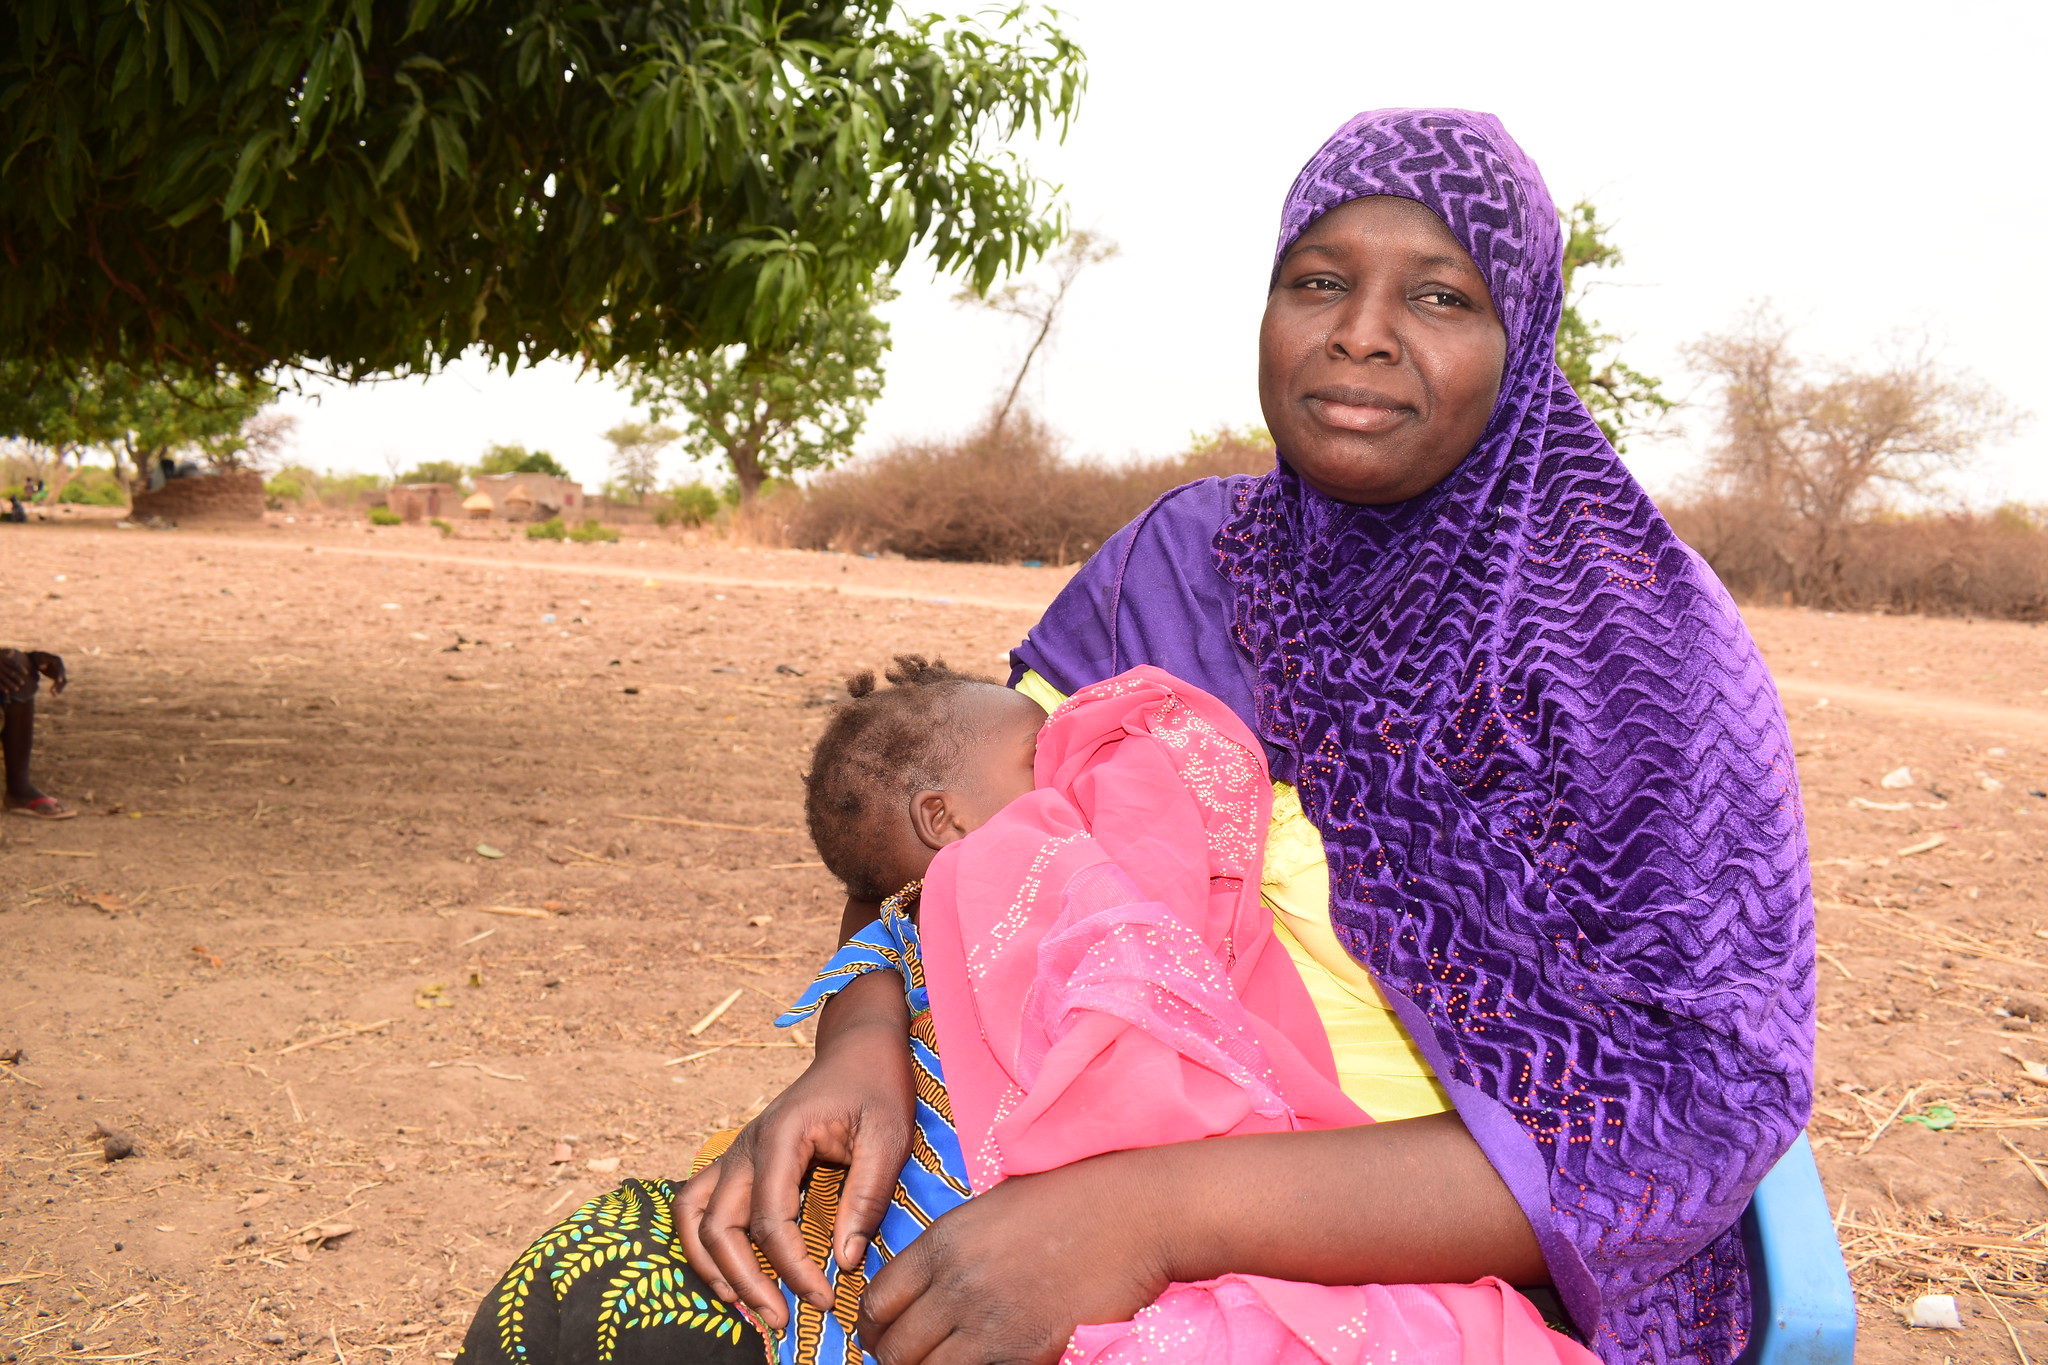
We acknowledge our duty to act as stewards, ensuring the safety of children, communities, and all those impacted by our work. Moreover, we recognize our duty to foster a conducive environment to realize our organizations’ ambitions and aspirations.
Our Integrity Line provides a safe and confidential way to report concerns and helps us protect the people and communities we serve.
All reports are treated with strict confidentiality, and we maintain a zero-tolerance policy for retaliation against individuals who report concerns in good faith.
If you have any concerns, please make a report through the contacts below:
> Living Goods Ethics Portal – Link
> Email – reports@lighthouse-services.com (must reference Living Goods in the report)
> Integrity Lines;
1. Kenya: 800-603-2869 (Toll Free) | +254 721 611027
2. Uganda: 800-603-2869 (Toll Free) | +256 414 233 063 | +256 392 202 030
3. United States: 800-603-2869 (Toll Free)


")